Yield Curves: What Are They and What Do They Mean?
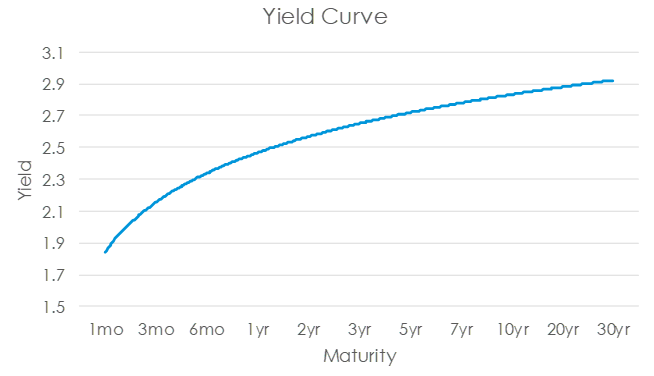
The yield curve is a graph that plots the cost of borrowing across a range of maturities. As an example, the illustration [below] shows longer-term securities, such as those with 30-year maturities, offer a yield higher than shorter-term securities. An upward-sloping curve such as this is typical in a normal economic environment, as investors typically require higher returns for longer-dated securities, given the risk of long-term uncertainty.
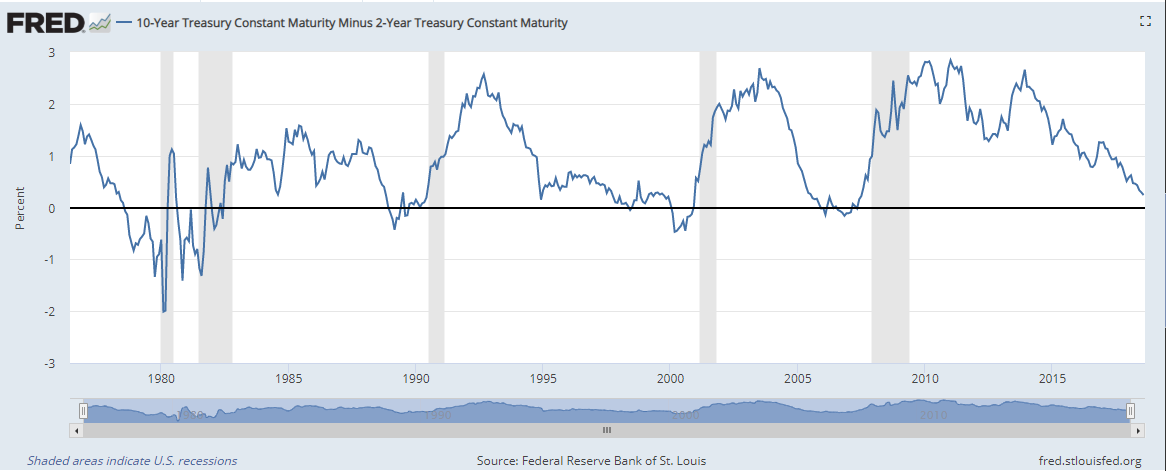
sThe yield curve can be used as a leading indicator for the security issuer’s financial wellbeing. For example, the US Treasury yield curve may indicate the direction the US economy is heading. When economic conditions become increasingly unsteady, such as before periods of slowed economic growth or a recession, the yield curve will begin to flatten. This means that the yield on long-term securities will reduce to a level closer to the yield of short-term securities or short-term yields will increase closer to those of long-term yields. The “spread” in yields, or the difference between a given long-term and a given short-term security, may narrow or even invert when there appears to be more short-term risk than long-term risk.
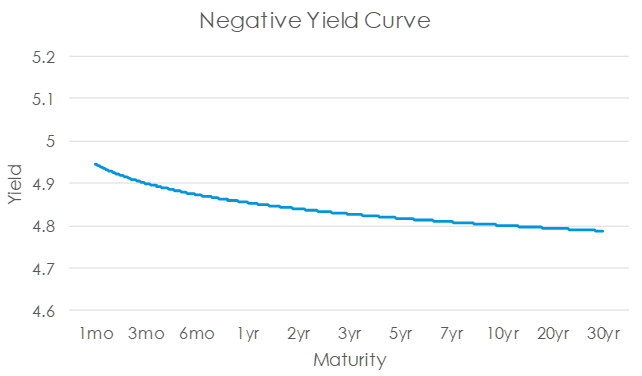
Historically, the US Treasury yield curve has sloped negatively (a negative yield spread), meaning select short-term Treasury yields are greater than select long-term Treasury yields, prior to US recessions. The charts below display a negative yield curve (dated 12/29/2006) as well as historical yield spreads coinciding with US recessions.
Historically, the US Treasury yield curve has sloped negatively (a negative yield spread), meaning select short-term Treasury yields are greater than select long-term Treasury yields, prior to US recessions. The charts below display a negative yield curve (dated 12/29/2006) as well as historical yield spreads coinciding with US recessions.