
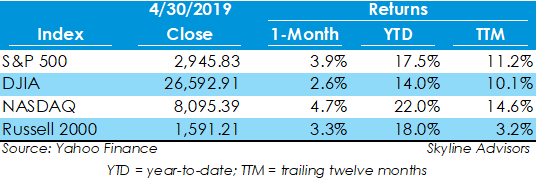
 Stock market indices increased 2.6% or more in April, as earnings season continued with generally positive results and economic news. The S&P 500 marked its best four-month stretch in nearly nine years, increasing 3.9% to 2,945.83. The Dow Jones Industrial Average (DJIA), NASDAQ, and Russell 2000 also increased 2.6%, 4.7%, and 3.3%, respectively. Year to date, these indices are up 14% or more. 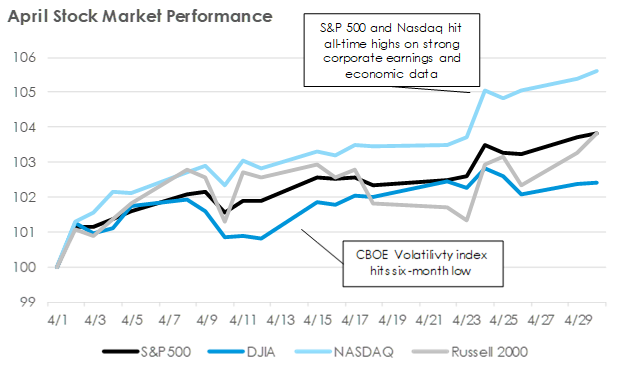 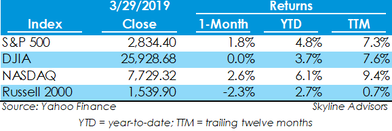 Stocks ended a volatile month with mixed results, with the S&P 500 index registering a 1.8% gain in March, while the Dow Jones Industrial Average, NASDAQ, and Russell 2000 closed the month with 0%, 2.6%, and -2.3% returns, respectively. It was the strongest quarter for the S&P 500 since the second quarter of 2009.
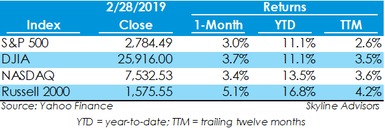 The stock market continued to rebound from its weak performance in December, as the S&P 500, Dow Jones Industrial Average (DJIA), Nasdaq, and Russell 2000 all climbed 3.0% or more in February. Year to date, the indices are up more than 11.0%. Small stocks appeared to outperform larger stocks, as the Russell 2000 rose 5.1%, outperforming its larger index peers during the month.
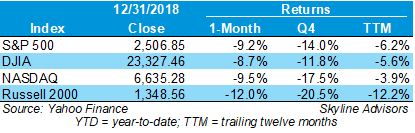 The stock market ended deeply negative in December, with the S&P 500, Dow Jones Industrial Average (DJIA), NASDAQ, and Russell 2000 each losing over 8%. The worst market performance in December since 1931 sent the S&P 500, DJIA, and NASDAQ into negative territory for the year, with the S&P 500 down 6.2%, the DJIA down 5.6%, and NASDAQ down 3.9%. The Russell 2000 was down 12.2% in 2018. The year accounted for the worst market performance since 2008.
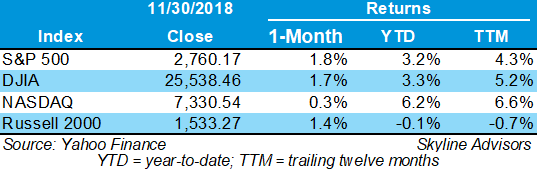 Stocks finished strong on the last day of November, helping major indices move further into positive territory. The S&P 500 closed up 1.8% to 2,760.17, the Dow Jones Industrial Average (DJIA) ended up 1.7% to 25,536.46, and the NASDAQ closed up 0.3% to 7,330.54. Rumors of easing trade tensions with China on Friday helped the NASDAQ move into positive territory for the month. Only the Russell 2000 is in negative territory for the year.
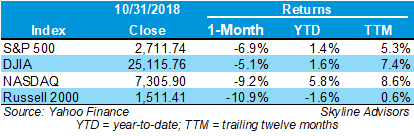 US equities rallied on the last day of the worst month for the S&P 500 since September 2011. The S&P 500 closed the month down 6.9%, the Dow Jones Industrial Average (DJIA) closed down 5.1%, the NASDAQ ended down 9.2%, and the Russell 2000 finished down 10.9%. Before the last week of the month, both the DJIA and S&P 500 entered negative territory for the year.
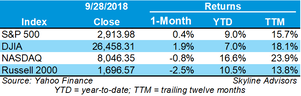 Stocks ended September mixed, as the S&P 500 and the Dow Jones Industrial Average (DJIA) led positive returns, while the Nasdaq and the Russell 2000 declined.
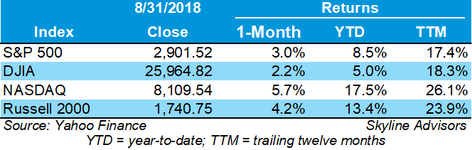 The Dow Jones Industrial Average (Dow) and S&P 500 had their best August since 2014, closing up 2.2% to 25,964.82 and 3.0% to 2,901.52, respectively. The Nasdaq, which finished the month up 5.7% at 8,109.54, had its best August performance since 2000. During the month, the S&P 500 and Nasdaq reached record highs.
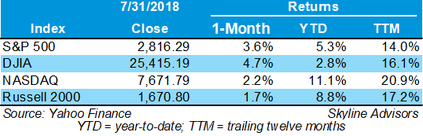 Markets performed well in July, with major indices closing in strong, positive territory. The S&P 500 increased 3.6% to 2,816 in July and is up 5.3% year to date. Similarly, the Dow Jones Industrial Average (DJIA) increased nearly 5% during the month to 25,415.19, and the NASDAQ increased 2.2% to 7,671.79.
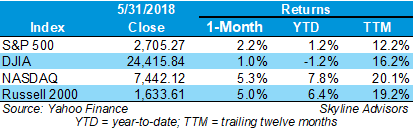 Despite closing down considerably on the last day of May - due to confirmation that the US will proceed with tariff plans against its North American and European allies - broad indices closed the month of May in positive territory.
|
Archives
May 2023
Categories
All
|
 RSS Feed

|
Skyline Advisors is a division of Ideation Ventures, Inc. Services involving securities are offered through M&A Securities Group, Inc.4151 N Mulberry Drive Suite 252, Kansas City, MO, 64116 (“MAS") . Services involving real estate brokerage are offered through Berkshire Hathaway HomeServices Ambassador Real Estate ("BHHS"). Skyline, MAS, and BHHS are separate entities.
COPYRIGHT 2024. ALL RIGHTS RESERVED. |